Lesson 2: Calculations and Graphing in Chemistry
OBJECTIVES
Understand how to solve problems dealing with density
Examine the algebra needed to solve chemistry problems
Understand that units must be treated as factors in chemistry problems and solve problems using these unit factors
Define and recognize unit multipliers and compile a list of unit multipliers that can be used to make conversions
Work problems using unit multipliers to make conversions.
Learn how to measure the mass and volume of water
Graph the results of a lab and use the graph to determine the density of a solution
Determine the percent error in a problem
DISCUSSION: Density
Density is the ratio of mass over volume. Density is an important characteristic for identifying substances. When you see a rock, you visually appraise its size and estimate its mass. You have estimated its density. If you pick the rock up and find it is five times heavier than you anticipated you say, "This must be a kind of rock that is different from usual." If you pick up a piece of metal and notice that it is gray colored and has a high mass to volume ratio, you might guess that the metal is lead because lead is the most common metal with a high density.
There are many kinds of ratios: distance/time (speed), price/ pound (unit price), individuals/acre (population density), etc. All of these things can be expressed in a simple equation. If you learn how to use these equations, you will have a powerful tool to solve problems.
If you know the density and volume of an object, you can calculate its mass:

When you solve the problem for volume, the equation becomes:
Lab Activity Hints
Density
Density is a characteristic property of a pure substance. Density is the ratio of mass over volume, D = m/V. The concept of density is one we encounter everyday. When we get a glass of water to drink, if we add ice cubes (solid water), the ice cubes float. The ice cubes are less dense than the liquid water in which they float. If you go to a gas station after a rainfall, you may see puddles with swirling patterns on top – the gasoline that washes into the puddles is less dense than the water, so the gasoline floats. If you are preparing a cake, the recipe may call for oil as well as water. When the oil and the water are placed in the same measuring cup, we observe the oil floating on the water; we can clearly observe 2 layers. In this case the water is more dense than the oil. On a molecular level, density refers to the arrangement of the atoms and molecules of a substance, the "packing." Substances whose atoms or molecules are packed more closely together are denser. In general, solids are more dense than liquids, which are more dense than gases. Water solid (ice) is an important exception to this rule, and we will discuss this in more detail when we discuss intermolecular forces in a later chapter.
DISCUSSION: What a Concept! 1=1!
You know that one times a number is still that same number.
Unit multipliers may not look like one times a number, but they are. It is often helpful to reduce the problem to the simplest examples. Let's look at some simple examples.
![]()

Because these ratios are all equal to one, they are called unit multipliers. You can multiply a number by a unit multipliers and still have the same number.
The real power of unit multipliers is converting from one unit to another. Combined with what we have learned about working with units in the previous section, this concept becomes a very useful process.
Unit Conversions You Should Know
Below is a partial list of unit multipliers most commonly used during the course. You may wish to add to this list or write the list where you can refer to it easily.
This not an exhaustive list. Many of the unit multipliers are just a matter of learning the metric prefixes.
Unit Multipliers
|
Length |
Volume |
Mass |
Amount |
|
1 m = 1000 mm 1 m = 100 cm 1 m = 10 dm 1 km = 1000 m |
1 L = 1 dm3 1 dm3 = 1000 cm3 1 cm3 = 1 mL 1 L = 1000 mL |
1 kg = 1000 g 1 g = 1000 mg
|
1 mol = 6.02 x 10²³ things
|
Units as Factors in Chemistry Problems
Units have an important function: the unit specifies what is measured. For instance, if a sign on the interstate indicated that the next exit is 5.5 away, how far would it be? Maybe 5.5 miles, or 5.5 kilometers, both common distance units, or maybe something else! That may not seem too important, until you consider the fact that a 5 mile run is about 1.6 times longer than a 5K run. So units do matter!
We use units in our calculations, so we must know how they work. Units add, subtract, multiply, and divide, according to the examples provided. You are probably familiar with this concept from math class; if not, these examples will help.
Use these sample problems to help you answer the questions.
ex 1. Units in division:
a. 55.2 g/125 mL = 0.442 g/mL
b. 10 gallons x 35 miles/gallon = 350 miles
ex 2. Units in
multiplication:
c. 12.0 cm x 10.5 cm x 6.7 cm = 844 cm3 (“cubic centimeters”)
d. 4.5 ft x 5.3 ft = 24 ft2 ("square feet")
ex 3. Example word problems:
e. A sample of metal has dimensions length =7.2 cm, width = 1.5 cm, and height =
2.4 cm. What volume of space does the metal occupy? (A: 26 cm3)
f. The same sample of metal weighs 2.95 g, and density = mass/volume. What is
the density of the metal? (Hint: use the volume you calculated in the previous
example.)
Answer: D = 2.95 g/ 26 cm3 = 0.11 g/cm3
Scientists use a wide variety of abbreviations and symbols to stand for units. No matter what the unit is, the same rules of unit manipulation apply.
Here are more examples of this process:
ex 4.
![]()
ex 5.
![]()
The same approach to units that we have already used also works when we are converting between different types of units, even in different systems of measurement. Following this approach helps us keep track of the units we have in our starting quantity and the units we want in our answer.
ex 6. How many gallons are in 46.0 L? Look for a conversion factor that relates gallons and liters in the table provided.
|
Conversion Factors |
||
|
Mass |
Length |
Volume |
|
2.205 lb. = 1.000 kg |
1.094 yd. = 1.000 m |
1.0 quart = 0.946 L |
|
1.000 lb. = 453.6 g |
0.3937 in. = 1.000 cm |
1000 ft3 = 28.3 L |
|
1.000 oz. = 28.35 g |
0.6214 mile = 1.000 km |
1.00 gal = 3.785 L |
To solve our conversion problem, we need the factor 1.0 gal = 3.785 L. Begin with the information we have, our measured volume, 46 L, and the information we want (its equivalent in gallons):


We arranged our conversion factor in a specific manner: the units we wanted in our answer remained on top (in the numerator), while the units in our original number were in the denominator. We multiplied 46.0 by 1.00, then divided by 3.785.
DISCUSSION Why Make Graphs?
Long tables of data are tedious and often hard to follow. Not only that, it is difficult see trends in the tables' data that may be important to research. There are other ways to display data, however. For example, a group of research assistants studying nuclear energy might compile all their data and graph the information using a computer spreadsheet. The data available on one graph would have taken 20 pages of tables. The graph would also show the data in a clear and more useful manner, making the researcher's analysis much easier. (Learning how to make these graphs using a computer spreadsheet would be very beneficial. Consult your teacher to determine if this option is available to you.)
Graphing
Graphing is a technique we use to arrange information in a visual manner. We can observe trends and draw conclusions from graphical information quickly and easily. Graphs can also help us to predict future values once we have established a pattern. Many graphs are depicted in line form, because linear graphs are more easily used to extrapolate (continue a set of data along a trend), interpolate (find a value between two data points), and detect unreliable data. The slope of a line graph is readily obtained and often provides useful information.
Here is an example showing how to find the slope of line.
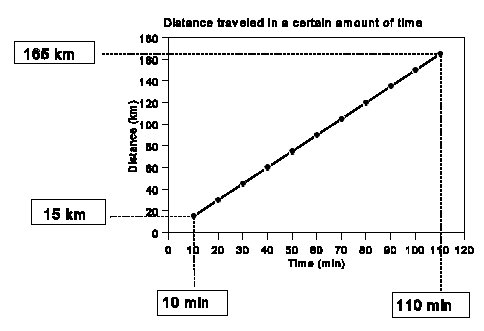

Finding the slope of a line
1. Locate two points on the graph as shown.
2. Draw in the line as indicated.
3. Determine the x and y values for each.
4. The slope is often referred to as rise over run, or the change in the y-axis between those two points divided by the change in the x-axis between those two points.
5. In this case, notice that the ratio of rise over run has units of distance over time. The slope of this line is the speed the object was going in km per minute
To graph a set of data, the information must first be collected by the experimenter. If we wish to measure how long it takes boiling water to cool to room temperature, we record the temperature of the water at different time intervals after first boiling the water. Since the experimenter controlled time by choosing when to observe the temperature, time is the independent variable. The independent variable should be shown on the horizontal axis of the graph, the x-axis. Temperature is the dependent variable, since the temperature observed by the experimenter depends on the time at which it was observed. The dependent variable should be shown on the vertical axis of the graph, the y-axis.
Next, we must decide how many units we need on each axis of our graph. We want our graph to be easy to draw and read. The best graphs also fill more than half the available graph paper in each direction. For the independent variable on the x-axis, if we had 9 times at which we made measurements, we could separate them each along one ninth of the horizontal space of the graph paper. Alternatively, we might make graphing a bit easier and mark 10 divisions on our x-axis, even though we need only 9. This makes our graphing simpler, which can help us reduce mistakes. The same principle would apply to any set of measurements; using a total number of divisions that can be divided by 5 or 10 is often easier to graph. Having more divisions than absolutely necessary also allows space for extrapolation. For our dependent variable, we use the same process. We would also have 9 temperature readings that we observed, one at each time interval. Here is an example graph of our time and temperature data:
|
Table of Collected Data
|
|
|
Time (min)
|
Temp (°C)
|
|
0 |
99.5 |
|
5 |
92.5 |
|
10 |
85 |
|
15 |
78 |
|
20 |
71 |
|
25 |
65 |
|
30 |
57 |
|
35 |
50 |
|
40 |
40 |
This graph can be generated using a pencil and graph paper, a spreadsheet such as MS Excel, or a graphing calculator such as a TI-83.
Percent Error
Percent error is a number that is easy to calculate yet has an important meaning. Percent error refers to the percent difference between the correct answer and an answer obtained by measurement or theoretical calculation. Most often percent error is used to measure the accuracy of experimental measurements. Recall that accuracy refers to closeness to true, correct value. So, a small percent error refers to a very accurate measurement, and a high percent error refers to a measurement that is not very accurate. To calculate percent error, you need to know the correct value for a measurement (in some situations this is simply the accepted value); you must also know your measured value in the same units as the correct value. To express percent error, use this equation:
|
Measured value – correct value |
x 100 = |
% error |
|
Correct value |
ex 7. Measured value of a length: 9.88 m Correct value: 9.55 m
Percent error (measured compared to correct):
|
9.88 m - 9.55 m |
x 100 = |
3.45% error |
|
9.55 m |
|
Remember that if a percent error calculation results in a negative number, it does not mean that you have “less than zero error”; a negative percent error indicates that your measured value is simply “lower than” the correct value by the calculated percent. |